User guide

Getting Started with BARC
The BARC tool is split into three distinct sections, the Annotation toolbox, the Lab book and the Report generator.
The Annotation toolbox
The Annotation toolbox provides the functionality to select from various weather/ forecasting icons and annotate on the displayed meteorological data. The toolbox provides a hosts of freeform drawing tools which enables the user to mark features such as extreme temperature or convection with ease as well as highlight features that they wish to draw attention to.
The DigitallLab book
The digital lab book allows the user to input notes and comments which can be linked to the displayed meteorological data and to any annotations and markups the user has added to the current data. Both the comments and the annotations can be saved to allow the user to revisit their previous work.
The Report Generator
The report generator provides the capability to generate case studies and model evaluation feedback reports. It features a comprehensive search and allows users to find previous reports and events from keywords and metadata.
Initialising BARC
To open the BARC use the tree icon (left) and the BARC panel will appear in a pop out window on the right side of the browser.
The Annotation toolbox
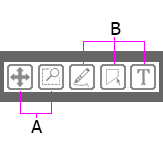
The main toolbar provides the basic tools the user requires to start using BARC.
The toolbar contains two distinct sets of tools. The first set (A) are used for navigation, e.g zoom and move. The second set (B) are freeform drawing tools.
Selection and navigation tools

Move/pan tool
This tool will move/pan the map view by holding the left mouse button and dragging. This tool used in conjuction with the zoom tool allow the user to define their view.

Box zoom tool
The box zoom tool allows the user to define a rectangular region to zoom. This is done by holding down the left mouse button and dragging to the desired area.
Drawing and type tools

Freehand drawing tool
Allows the user to draw freehand on the displayed content. Line thickness and colour can be selected.

Polygon add tool
Use this tool to create polygons on the displayed content.
To move the polygon Select the polygon tool and then drag the polygon to a new location. You can also move multiple polygons by holding shift.
To delete a polygon Select the polygon tool and then select the first point created, then press BACKSPACE.

Text add tool.
This feature is coming soon it will allow the user add text to the active content.
Select Size

The size select slider allows the user to scale both the stamps and the custom lines. Move the slider to the right to increase the size. The smallest setting is 1 the largest is 10.
Stamp Colour
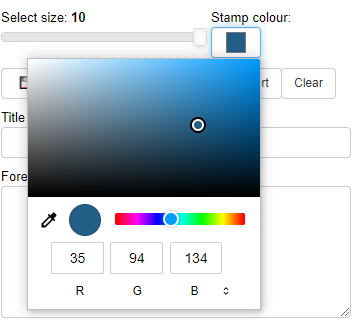
Stamp colour provides an easy way to accees different colours for the meterological symbols included in BARC. Select stamp the colour and either select your desired colour from the displayed pallete. The stamp colour tool allows for direct input of colour values in RGB (Red Green Blue), hsl (hue, saturation, and lightness) and hex.
Save button
This button saves all text and annotations currently created in BARC. The title field is mandatory and is used for loading your content back into BARC.
Load button
The load button will load your previous annotations and text back into the BARC inteface. By selecting the load button previous saved worked sessions are displayed including a date stamp of when the work was completed in the drop-down list. Select the required title to load previous work.
Export button
The export button provides the user with a tool to export their annotations, notes, metadata and details and the loaded data as a single document. The annotations will be outputted as a full screen image and include all the markings, custom lines and glyphs. It will also combine the contents of all the freeform textboxes and outline what meta data was selected in the checkboxes at the bottom of the lab book. Key information about The data within FOREST wil also be included in the report. This will be included below the image data, and will specify the data file loaded, the variable and the timestep.
Clear button
The clear button will remove all text and annotation from the current session.
Meteorological symbols
BARC has a large host of specfic meteorological symbols availble. These symbols are displayed in groups of similar weather features or characteristics. To select a group of symbols use the dropdown toolbar and then select the specfic symbol you want to use. More information about what the symbol represents is displayed when you hover over the icons. Group 0 - 9 reference the well established World Meteorological Organisation (WMO) present weather symbols.
| Symbol | Code | Description |
|---|---|---|

|
0 | Cloud development not observed or not observable |

|
1 | Cloud generally dissolving or becoming less developed |

|
2 | State of sky on the whole unchanged |

|
3 | Clouds generally forming or developing |

|
4 | Visibility reduced by smoke, e.g. veldt or forest fires, industrial smoke or volcanic ashes |

|
5 | Haze |

|
6 | Widespread dust in suspension in the air, not raised by wind at or near the station at the time of observation |

|
7 | Dust or sand raised by wind at or near the station at the time of observation, but not well developed dust whirl(s) or sand whirl(s), and no duststorm or sandstorm seen; or, in the case of ships, blowing spray at the station |

|
8 | Well developed dust or sand whirl(s) seen at or near the station during the preceding hour or at the time of observation, but no dust storm or sandstorm |

|
9 | Duststorm or sandstorm within sight at the time of observation, or at the station during the preceding hour |

|
10 | Mist |

|
11 | Patches of shallow fog or ice fog at the station, whether on land or sea not deeper than about 2 metres on land or 10 metres at sea |

|
12 | More or less continuous shallow fog or ice fog at the station, whether on land or sea, not deeper than about 2m/land or 10m/sea |

|
13 | Lightning visible, no thunder heard |

|
14 | Precipitation within sight, not reaching the ground or the surface of the sea |

|
15 | Precipitation within sight, reaching the ground or the surface of the sea, but distant, i.e. > 5 km from the station |

|
16 | Precipitation within sight, reaching the ground or the surface of the sea, near to, but not at the station |

|
17 | Thunderstorm, but no precipitation at the time of observation |

|
18 | Squalls at or within sight of the station during the preceding hour or at the time of observation |

|
19 | Funnel clouds at or within sight of the station during the preceding hour or at the time of observation |

|
20 | Drizzle (not freezing) or snow grains, not falling as showers, during the preceding hour but not at the time of observation |

|
21 | Rain (not freezing), not falling as showers, during the preceding hour but not at the time of observation |

|
22 | Snow, not falling as showers, during the preceding hour but not at the time of observation |

|
23 | Rain and snow or ice pellets, not falling as showers; during the preceding hour but not at the time of observation |

|
24 | Freezing drizzle or freezing rain; during the preceding hour but not at the time of observation |

|
25 | Shower(s) of rain during the preceding hour but not at the time of observation |

|
26 | Shower(s) of snow, or of rain and snow during the preceding hour but not at the time of observation |

|
27 | Shower(s) of hail, or of rain and hail during the preceding hour but not at the time of observation |

|
28 | Fog or ice fog during the preceding hour but not at the time of observation |

|
29 | Thunderstorm (with or without precipitation) during the preceding hour but not at the time of observation |

|
30 | Slight or moderate duststorm or sandstorm, has decreased during the preceding hour |

|
31 | Slight or moderate duststorm or sandstorm, no appreciable change during the preceding hour |

|
32 | Slight or moderate duststorm or sandstorm, has begun or has increased during the preceding hour |

|
33 | Severe duststorm or sandstorm, has decreased during the preceding hour |

|
34 | Severe duststorm or sandstorm, no appreciable change during the preceding hour |

|
35 | Severe duststorm or sandstorm, has begun or has increased during the preceding hour |

|
36 | Slight/moderate drifting snow, generally low (below eye level) |

|
37 | Heavy drifting snow, generally low (below eye level) |

|
38 | Slight/moderate blowing snow, generally high (above eye level) |

|
39 | Heavy blowing snow, generally high (above eye level) |

|
40 | Fog or ice fog at a a distance at the time of observation, but not at station during the preceding hour, the fog or ice fog extending to a level above that of the observer |

|
41 | Fog or ice fog in patches |

|
42 | Fog/ice fog, sky visible, has become thinner during the preceding hour |

|
43 | Fog/ice fog, sky invisible, has become thinner during the preceding hour |

|
44 | Fog or ice fog, sky visible, no appreciable change during the past hour |

|
45 | Fog or ice fog, sky invisible, no appreciable change during the preceding hour |

|
46 | Fog or ice fog, sky visible, has begun or has become thicker during preceding hour |

|
47 | Fog or ice fog, sky invisible, has begun or has become thicker during the preceding hour |

|
48 | Fog, depositing rime, sky visible |

|
49 | Fog, depositing rime, sky invisible |

|
50 | Drizzle, not freezing, intermittent, slight at time of ob. |

|
51 | Drizzle, not freezing, continuous, slight at time of ob. |

|
52 | Drizzle, not freezing, intermittent, moderate at time of ob. |

|
53 | Drizzle, not freezing, continuous, moderate at time of ob. |

|
54 | Drizzle, not freezing, intermittent, heavy at time of ob. |

|
55 | Drizzle, not freezing, continuous, heavy at time of ob. |

|
56 | Drizzle, freezing, slight |

|
57 | Drizzle, freezing, moderate or heavy (dense) |

|
58 | Rain and drizzle, slight |

|
59 | Rain and drizzle, moderate or heavy |

|
60 | Rain, not freezing, intermittent, slight at time of ob. |

|
61 | Rain, not freezing, continuous, slight at time of ob. |

|
62 | Rain, not freezing, intermittent, moderate at time of ob. |

|
63 | Rain, not freezing, continuous, moderate at time of ob. |

|
64 | Rain, not freezing, intermittent, heavy at time of ob. |

|
65 | Rain, not freezing, continuous, heavy at time of ob. |

|
66 | Rain, freezing, slight |

|
67 | Rain, freezing, moderate or heavy |

|
68 | Rain or drizzle and snow, slight |

|
69 | Rain or drizzle and snow, moderate or heavy |

|
70 | Intermittent fall of snowflakes, slight at time of ob. |

|
71 | Continuous fall of snowflakes, slight at time of ob. |

|
72 | Intermittent fall of snowflakes, moderate at time of ob. |

|
73 | Continuous fall of snowflakes, moderate at time of ob. |

|
74 | Intermittent fall of snowflakes, heavy at time of ob. |

|
75 | Continuous fall of snowflakes, heavy at time of ob. |

|
76 | Diamond dust (with or without fog) |

|
77 | Snow grains (with or without fog) |

|
78 | Isolated star, like snow crystals (with or without fog) |

|
79 | Ice pellets |

|
80 | Rain shower(s), slight |

|
81 | Rain shower(s), moderate or heavy |

|
82 | Rain shower(s), violent |

|
83 | Shower(s) of rain and snow, slight |

|
84 | Shower(s) of rain and snow, moderate or heavy |

|
85 | Snow shower(s), slight |

|
86 | Snow shower(s), moderate or heavy |

|
87 | Shower(s) of snow pellets or small hail, with or without rain or rain and snow mixed, slight |

|
88 | Shower(s) of snow pellets or small hail, with or without rain or rain and snow mixed, moderate or heavy |

|
89 | Shower(s) of hail, with or without rain or rain and snow mixed, not associated with thunder, slight |

|
90 | Shower(s) of hail, with or without rain or rain and snow mixed, not associated with thunder, moderate or heavy |

|
91 | Slight rain at time of observation, Thunderstorm during the preceding hour but not at time of observation |

|
92 | Moderate or heavy rain at time of observation, Thunderstorm during the preceding hour but not at time of observation |

|
93 | Slight snow, or rain and snow mixed or hail at time of observation, Thunderstorm during the preceding hour but not at time of observation |

|
94 | Moderate or heavy snow, or rain and snow mixed or hail at time of observation, Thunderstorm during the preceding hour but not at time of observation |

|
95 | Thunderstorm, slight or moderate, without hail, but with rain and/or snow at time of observation |

|
96 | Thunderstorm, slight or moderate, with hail at time of ob. |

|
97 | Thunderstorm, heavy, without hail, but with rain and/or snow at time of observation |

|
98 | Thunderstorm combined with dust/sandstorm at time of observation |

|
99 | Thunderstorm, heavy with hail at time of observation |

|
99 | Hurricane |

|
100 | Category 1 - storms usually cause no significant structural damage to most well-constructed permanent structures; however, they can topple unanchored mobile homes, as well as uproot or snap weak trees. |

|
101 | Category 2 - Storms of Category 2 intensity often damage roofing material (sometimes exposing the roof) and inflict damage upon poorly constructed doors and windows. Poorly constructed signs and piers can receive considerable damage and many trees are uprooted Mobile homes, whether anchored or not, are typically damaged and sometimes destroyed, and many manufactured homes also suffer structural damage.Small craft in unprotected anchorages may break their moorings. Extensive to near-total power outages and scattered loss of potable water are likely, possibly lasting many days. |

|
102 | Category 3 - Devastating damage will occur. Tropical cyclones of Category 3 and higher are described as major hurricanes in the Atlantic or Eastern Pacific basins. These storms can cause some structural damage to small residences and utility buildings, particularly those of wood frame or manufactured materials with minor curtain wall failures. Buildings that lack a solid foundation, such as mobile homes, are usually destroyed, and gable-end roofs are peeled off. Manufactured homes usually sustain severe and irreparable damage. Flooding near the coast destroys smaller structures, while larger structures are struck by floating debris. A large number of trees are uprooted or snapped, isolating many areas. Additionally, terrain may be flooded well inland. Near-total to total power loss is likely for up to several weeks and water will likely also be lost or contaminated. |

|
103 | Category 4 - Category 4 hurricanes tend to produce more extensive curtainwall failures, with some complete structural failure on small residences. Heavy, irreparable damage and near-complete destruction of gas station canopies and other wide span overhang type structures are common. Mobile and manufactured homes are often flattened. Most trees, except for the hardiest, are uprooted or snapped, isolating many areas. These storms cause extensive beach erosion, while terrain may be flooded far inland. Total and long-lived electrical and water losses are to be expected, possibly for many weeks |

|
104 | Category 5 - is the highest category of the Saffir–Simpson scale. These storms cause complete roof failure on many residences and industrial buildings, and some complete building failures with small utility buildings blown over or away. Collapse of many wide-span roofs and walls, especially those with no interior supports, is common. Very heavy and irreparable damage to many wood frame structures and total destruction to mobile/manufactured homes is prevalent. Only a few types of structures are capable of surviving intact, and only if located at least 3 to 5 miles (5 to 8 km) inland. They include office, condominium and apartment buildings and hotels that are of solid concrete or steel frame construction, multi-story concrete parking garages, and residences that are made of either reinforced brick or concrete/cement block and have hipped roofs with slopes of no less than 35 degrees from horizontal and no overhangs of any kind, and if the windows are either made of hurricane-resistant safety glass or covered with shutters. Unless all of these requirements are met, the absolute destruction of a structure is certain. |

|
105 | Tropical depression - <29 Knots <55 km/h |

|
106 | Tropical storm - 30 - 55 knots 56-103 km/h |

|
107 | Typhoon - 56-113 knots 104-210 km/h |

|
108 | Super typhoon >114 knots >211 km/h |
Custom Lines
BARC has various custom lines included to allow multipoint curved lines to be drawn over the data. These lines include useful features such as fronts and troughs and will allow the user to create accurate curves where desired.
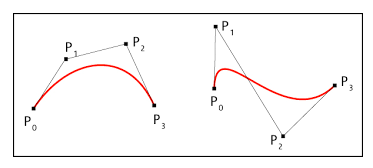
To create a Bézier curve requires at least four points are required to be placed on the canvas. First select the curved symbol you require from the toolbox, then double click on the canvas and contiue to place points until the curve is where required. To complete or exit the tool select the escape key.
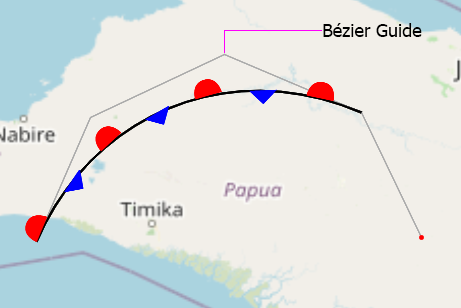
Show/hide Bézier Guides

When placing custom lines there is an option to to show or hide the Bezier guides. When this is enabled the greys guide lines are visible on the canvas.
Below is a table of the included lines and their descriptions.
| Symbol | Code | Description |
|---|---|---|

|
0 | Upper trough - Upper-level trough (Upper Tropospheric Trough, UTT) - upper-level cyclonic circulation associated with positive vorticity (usually around 200-hPa in the Tropics) that can be detected by analysis of upper-level streamlines (to detect cyclonic circulation) and vorticity (positive vorticity). Usually, the upper-level cyclonic circulation leads to a surface low-pressure developing ahead of the UTT which has associated convection at the surface with upper-level divergence. An intrusion of energy and wind from the mid-latitudes into the tropics causes UTTs to form |

|
1 | Dry Intrusion - mid-level dry air (500-700hPa) that is typically travelling from the midlatitudes into a tropical region and can either inhibit or organise convection depending on the stage of development. Dry air intrusions are usually detected using the gradients of dew-point temperature (-36 degrees) or relative humidity (less than 15%). |

|
2 | Stationary dry - boundary between air masses with significant moisture differences. |

|
3 | Cold Front - The leading, progressive edge of a density discontinuity ahead of a cooler/drier air mass. These boundaries tend to be narrower than warm fronts due to the higher density low-level air in their wake which helps drive their forward motion. Over the continent, a minimum of 6C (10F) over 500 km (300 nm) is usually needed for a frontal zone with smaller differences needed over the oceans. |

|
4 | Dry advection/pseudo cold front - is a boundary between a supercell’s inflow region and the rear flank downdraft. It usually extends outward from a mesocyclone center, usually toward the south or southwest, and is characterized by advancing of the downdraft air toward the inflow region. It is a particular form of gust front. |

|
5 | Warm front - The equatorward edge of a density discontinuity behind a retreating and modified cool, dry air mass. This type of frontal zone is significantly broader than a cold front, due to the slower erosion of the superior density airmass ahead of the boundary. Over the continent, a minimum of 6C (10F) over 300 nm (500 km) is usually needed for a frontal zone while smaller differences are necessary over the oceans. |

|
6 | Warm advection / pseudo warm front - is a boundary between the in-flow region and the forward-flank downdraft of a supercell. It can either be stationary or move in a northeasterly direction |

|
7 | Convergence - A zonally elongated axis of surface wind confluence in the tropics, due to confluence of northeasterly and southeasterly trade winds, and/or confluence at the poleward extent of cross-equatorial flow into a near-equatorial heat trough. It is depicted as a pair of ref lines with cross hatching. The feature is labeled as ITCZ on the Unified Surface Analysis |

|
8 | Squall lines - A solid line of convection, usually associated with rapid pressure fluctuations and high winds. The squall line will normally be placed at the leading edge of the wind shifts and inside the leading pressure trough. |

|
9 | Near Quatorial Trough - a region of low pressure that lies near to the equator and is associated with a convergence of the winds. The Intertropical convergence zone is referred to as a near equatorial trough when it occurs near to the equator. |

|
10 | Monsoon trough - An elongated area of low pressure along the Intertropical Convergence Zone (ITCZ) that leads to an enhancement of monsoon precipitation over land. To its south lie southwesterly low-level winds, as opposed to the ITCZ which is a confluent zone of easterly winds. The monsoon trough is the main focus for tropical cyclogenesis in the northwest Pacific ocean, and plays less of a role in tropical cyclone formation across the northeast Pacific, western Caribbean sea, and northeast Atlantic ocean. |

|
11 | Non active monsoon trough - Monsoon Trough area that is inactive, where there is no strong convection area. Ways to identification are : 1. Using gradient wind (925 hPa) 2. Observe the circulation patterns in the active monsoon (Asia or Australia), the trough pattern in the deep circulation is not included in the MT line. 3. and then draw the non active Monsoon Trough on the areas with less precipitation, low relative humidity contours, and also see WBPT and DPT contours are not warm enough around the trough |

|
12 | Low level jet - A fast moving ribbon of air in the low levels of the atmosphere. It can rapidly transport Gulf moisture and warmer temperatures to the North at speeds ranging from 25 to over 70 knots. |

|
13 | Streamline - lines that show the direction of wind flow at a particular pressure level. |

|
14 | Stationary front - The equatorward edge of a slow-moving density discontinuity with a motion of less than 10 knots (12 mph). Winds tend to lie parallel to these boundaries. Over the continent, a minimum of 6C (10F) over 500 km (300 nm) is usually needed for a frontal zone with smaller differences required over the oceans. |

|
15 | Occluded front - A front that forms southeast/east of a cyclone that moves deeper into colder air, in the late stages of wave-cyclone development. Cold occlusions result when the coldest air surrounding the cyclone is behind its cold front, and are normally seen on the west sides of ocean basins and with clipper systems descending from the arctic. Warm occlusions form when the coldest air surrounding the cyclone is ahead of its warm front, forcing the cold front aloft |
The Digital lab book
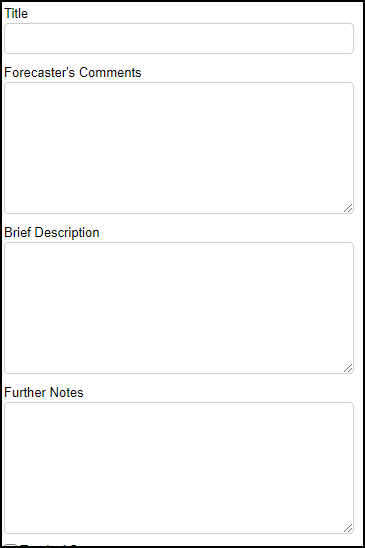
This feature enables users to comment on their annotations to provide reasoning and a more in-depth analysis than chart making alone. The lab book includes note taking capability this text can be saved or exported so thoughts and findings are accessible in the future. Currently there are four free form text boxes for the user to record their notes. The first text box is the Title box, each report requires a title and is mandatory. This field will be used as the reference for the user to reload there report if required. Once the title field is populated the save button will become active and enabled. The other three text boxes, Comments, Brief Description and Further notes are not mandatory and can contain any text to describe the data.
Metadata Flags
Meta data flags are found at the bottom of the lab book. This feature allows for the user to flag an event by selecting the relavant tag from the dropdown list. There are two catagories of meta data, HIW (High Impact Weather) and Synoptic.
To select meta data, select one of the two catagories and the select the relavent heading from the drop down menu.
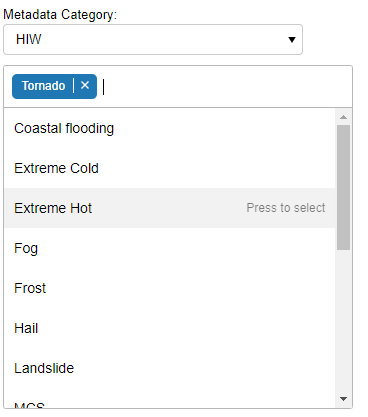
The table below shows the available tags within the two catagories.
| HIW | Synoptic |
|---|---|
| Coastal flooding | African Easterly Wave |
| Extreme Cold | Area of low pressure |
| Extreme Hot | Cold surge |
| Fog | Heat wave |
| Frost | ITCZ |
| Hail | Kelvin wave activity |
| Landslide | Localised convection |
| MCS | Meso-scale convection |
| Rapid response flooding | MJO phase 1 |
| River flooding | MJO phase 2 |
| Snow | MJO phase 3 |
| Storm / Lightning | MJO phase 4 |
| Storm surge | MJO phase 5 |
| Strong winds or gusts | MJO phase 6 |
| Surface water flooding | MJO phase 7 |
| Tornado | MJO phase 8 |
| Tropical storm / cyclone | Rossby wave activity |
| Sea / lake breeze | |
| South West Monsoon | |
| Tropical cyclone (directly / indirectly) | |
| Weak MJO |
The Report Generator
This will allow forecasters to produce high impact weather (HIW) case study reports detailing atmospheric analysis and information on HIW events (human/economic cost) that will be saved in a case study catalogue. Similarly, a model evaluation reporting function will also be included in the report generator, giving forecasters the ability to report on important model deficiencies such as false alarms, missed events or model biases. Both these report types will enable ‘in country’ forecasters to influence research and will steer scientists and model developers towards work that has the greatest impact locally.